The VBar worksheet contains the definitions for the #VBar object.
Option |
Parameter1 |
Parameter2 |
Text |
#Style |
bar bar filled |
||
#Range1 |
Number Percent [Index] Limit1 Limit2 |
Text1 |
|
... |
|||
#Range<n> |
|||
#Separator |
Number |
||
#Width |
Number/Percent |
||
#Border |
Number |
||
#Position |
Number/Percent |
Number/Percent |
|
#Values |
Number Range |
left right |
|
#Needle |
|||
#BarBackColor |
|||
#BarWidth |
Number |
Example
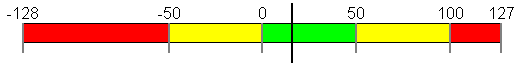
Range1 Range2 Range3 Range4 Range5 Range6
#Style
Parameter1 |
M/O |
Default |
Description |
bar |
O |
bar |
VBar is drawn with range colors. The actual value is shown with the pointer. The pointer is defined under #Needle. |
bar filled |
O |
VBar is filled with Range colors up to the actual value. The rest of the Vbar up to the end value is deleted with the background color #BarBackColor. |
#Range
The VBar object can be structured in any number of ranges (Range1..n). These ranges start with Range1 and are defined in ascending order without gaps.
Parameter1 |
M/O |
Default |
Description |
Number |
O |
0 |
The ranges can be defined as absolute with number values. The first and the last range define start (Limit1) and end (Limit2) of the VBar. |
Percent |
O |
0 |
The ranges are defined by percentage values of Range1 and the last range. Range1 and the last range can not be expressed by a percentage and must be absolute. In this case, it makes sense to use Limit1 and Limit2. Caution: If percent is used, the cell must be formatted in Excel as text, as Excel will otherwise make a number out of it (e.g.: 10% is changed to 0.1). A ' can also be written in front of the percentage value. |
[Index] |
O |
0 |
An array is specified under #VarValue of the VBar object, the ranges can then be defined from [1] to [n] and the ranges can be changed dynamically. [0] of the array contains the actual value. Range1 and the last range define the start and the end of the object. |
Limit1 Limit2 |
O |
0 |
If the value from Limit1 and Limit2 of the VBar object are to be used for a range, "Limit1" and "Limit2" can be written. |
Parameter2 |
M/O |
Default |
Description |
O |
0 |
Color defines the color of the range up to the next range n+1. |
Parameter3 |
M/O |
Default |
Description |
Text |
O |
The entered text is displayed at the position of the range, e.g. Min, Max, etc. Range texts can be defined as multilingual texts. |
|
O |
Specifying a format string, e.g. %d, enables the range values to be displayed. |
Parameter3 only functions in conjunction with #Values and parameter #Range.
#Separator
Parameter1 |
M/O |
Default |
Description |
<empty> |
O |
<empty> |
<empty> ...No separator is drawn between the ranges |
Number |
O |
0 |
Width of the separator line in pixels. The separator line is displayed with the color in the Parameter2 column. |
#Width
Parameter1 |
M/O |
Default |
Description |
Number |
O |
0 |
Length of the separator in pixels |
Percent |
O |
0 |
Length of the separator as a percentage of DX and DY |
#Border
Parameter1 |
M/O |
Default |
Description |
Number |
O |
0 |
Width of the frame in pixels. The frame is drawn with the color in the Parameter2 column. |
#Position
Parameter1 |
M/O |
Default |
Description |
Number |
O |
0 |
X position of the graph in pixels relative to the object zero point (top left) |
Percent |
O |
0 |
X position of the graph as a percentage of DX. |
Parameter2 |
M/O |
Default |
Description |
Number |
O |
0 |
Y position of the graph in pixels relative to the object zero point (top left) |
Percent |
O |
0 |
Y position of the graph as a percentage of DY. |
#Values
Parameter1 |
M/O |
Default |
Description |
<empty> |
O |
<empty> |
No range values are displayed |
Number |
O |
0 |
A number defines the range for the scale. The scale is drawn with all multiples of this number up to the end of the object. e.g. 10 causes a scale of 0, 10, 20,... |
Range |
O |
If Range is specified, the scale shows all texts that were specified under #Range1, …. If formats were defined in the Text columns, the values of these ranges are displayed.
|
Parameter2 |
M/O |
Default |
Description |
Left Right |
O |
Left |
Specifies the position of the scale. "Left" for left and top, "Right" for right and bottom |
Parameter3 |
M/O |
Default |
Description |
O |
%d |
Format for displaying scale values. |
#Needle
Parameter1 |
M/O |
Default |
Description |
Integer |
O |
0 |
Draws a pointer with the specified width in pixels. |
Parameter2 |
M/O |
Default |
Description |
O |
Black |
Color of the pointer. (only in conjunction with Parameter 1) |
Text/File |
M/O |
Default |
Description |
O |
Draws the defined image as a pointer at the position of the current value. Parameters 1 and 2 are irrelevant. |
#BarBackColor
Background color in conjunction with #Style=bar filled.
#BarWidth
Parameter1 |
M/O |
Default |
Description |
Integer |
O |
0 |
Width of the bargraph in pixels. |