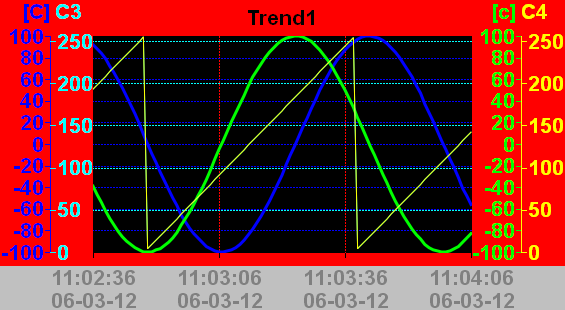
The #Trend object can be used to display data recorded with the #Datalog object in the form of a trend (max. 4 curves in one trend). The values can be displayed online and offline. The current section can be manipulated by means of #Button actions.
The trend is normally shown as a Y/T graph. The Format_time=%ld option is used to display the value of the time stamp (double word in Datalog) as an integer (1,2,3,...). This enables X/Y graphs such as for temperature controllers to be displayed.
Example
Parameters
Object
M/O |
Default |
Description |
|
#Trend |
M |
Trend object |
Text/File
M/O |
Default |
Description |
|
<Trend definition>.txt |
M |
Name of the trend definition contains the attribute for displaying the #Trend object. |
Font
M/O |
Default |
Description |
|
<Fontname>.FNT |
O |
Font for displaying the axis scales |
X, Y, DX, DY
M/O |
Default |
Description |
|
Integer constants Variable of type INT |
O |
Position and dimension |
Color
M/O |
Default |
Description |
|
O |
Color for inscription and background of the curve area |
BackColor
M/O |
Default |
Description |
|
O |
Color for background of the edge area and cursor |
Format
M/O |
Default |
Description |
|
O |
No frame |
Type of frame, all except Border=Shadow |
|
Border=Standard |
O |
Standard Qt-Border |
VarState
Option
M/O |
Default |
Description |
|
DX=<width> |
O |
25 |
Defines the width of the vertical scroll bar in pixels. 0 = Hide scroll bar |
DY=<height> |
O |
25 |
Defines the height of the horizontal scroll bar in pixels 0 = Hide scroll bar |
type=<name> |
O |
<name> stands for the ID or name of the Trend object. This ID is relevant for button actions. If it is not set, the name of the text file without the file ending is used as the ID. If the Datalog Name is not set in the definition file, <name> is used. A trend definition can thus be used for different #Datalog objects. |
|
datalog=<name> |
O |
If the Datalog Name is not set in the definition file, <name> is used.This option has precedence over type=<name>. The parameter <name> may contain index variables. Sample: datalog=starter%/S/TMP/StarterIdx%
|
|
cursor=off |
O |
Deactivates the cursor. |
See also